Evidence

What the evidence says about AI.

Surveys show AI use is growing. Cases describe reported improvements in specific tasks and assets. Neither can tell you what AI is worth to your organisation; that takes a test on your own work.

This summary draws on 301 public examples and 53 surveys, collected and reviewed by 38thMove.

The findings

Three things the evidence shows.

Use is growing, but routine use is uneven.

Five recurring survey series report growing use. In RIBA’s 2026 survey, 74% of respondents say their practice uses AI, but only 19% report a documented AI policy. Trying AI is different from making it a governed part of everyday work.

Read the survey analysis →
The benefits go beyond faster documents.

Reported benefits include faster work, lower energy use and earlier intervention. GWL reports preliminary 25–29% reductions in heating, ventilation and cooling energy; Yorkshire Water reports 15% fewer reactive site visits.

See the cases in more detail ↓

Value depends on accepted work and full costs.

A faster task only creates value if the output is usable once it has been checked and corrected, and the gain outweighs running costs. Many case accounts leave those costs out, so evidence of organisation-wide return is still thin.

How to build your own case →

What the cases show

Four lessons from 301 examples.

The best uses connect information to action.

Leak analysis directs investigations, image inspection helps engineers prioritise checks and building controls respond to measured conditions. National Grid uses AI for a first pass at grading corrosion on pylons; Suffolk used it to target schedule recovery. The question is what changed once the information arrived.

Some firms are building their own AI tools for staff to share.

Turner builds internal workflow apps, Mott MacDonald’s assistant opens up company knowledge and Arcadis engineers configure reusable technical checks. The sources say how many people use them. They mostly do not show whether the answers are reliable or the firm is more productive.

People still check the work, and speed is not quality.

Engineers verify findings, planners keep statutory decisions and operators investigate alerts. Seattle’s test of automated permit checks agreed well on the checks it was set up for, but missed others. Speed and quality need separate tests.

Failures and local wins both carry lessons.

Victoria’s audited bridge-monitoring venture cost public money without a single accepted installation. Northumbrian Water says AI helped prevent sewer overflows during specific storms, while its company-wide pollution figures worsened. A local gain does not guarantee a better organisation.

Four views of the database

What the whole collection shows.

Because every example is classified the same way, I can look across all 301 at once. These four charts are a taste of what the database can answer.

Where AI appears in the work

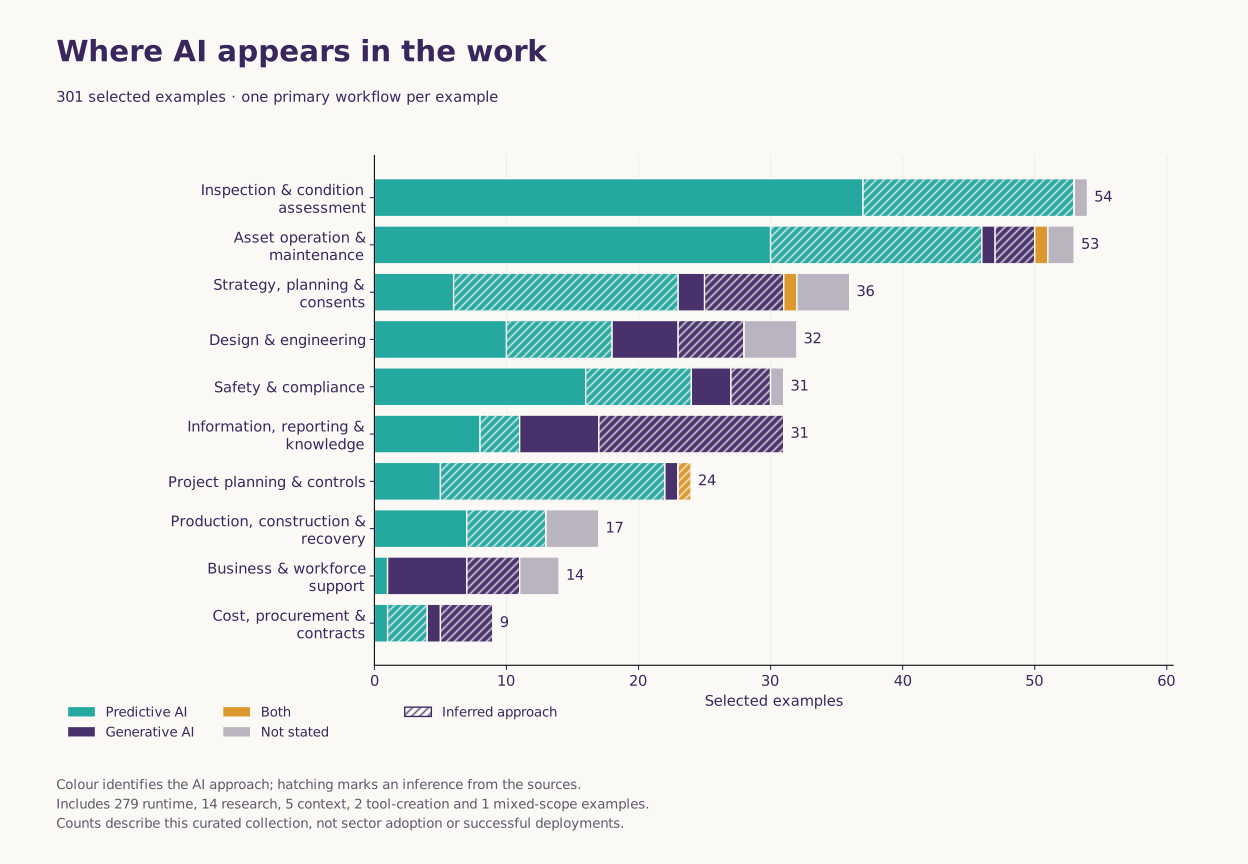
More than a third of the cases are about inspecting and running assets, and most use AI that predicts, detects or optimises rather than writes.

Bar chart of the 301 examples by ten workflows and four types of AI

Inspection and condition assessment (54 cases) and asset operation and maintenance (53) lead the collection. About 7 in 10 cases use predictive AI, which spots, forecasts and optimises (for example image recognition, leak detection and scheduling); about 1 in 5 use generative AI, which writes and creates.

Open the full-size chart →
How to read this chart

Each of the 301 examples is counted once, under its main workflow. Hatched bars show where 38thMove judged the type of AI because the source did not say. The mix reflects what organisations publish, not how common each use is in the market.

Which assets and stages are covered

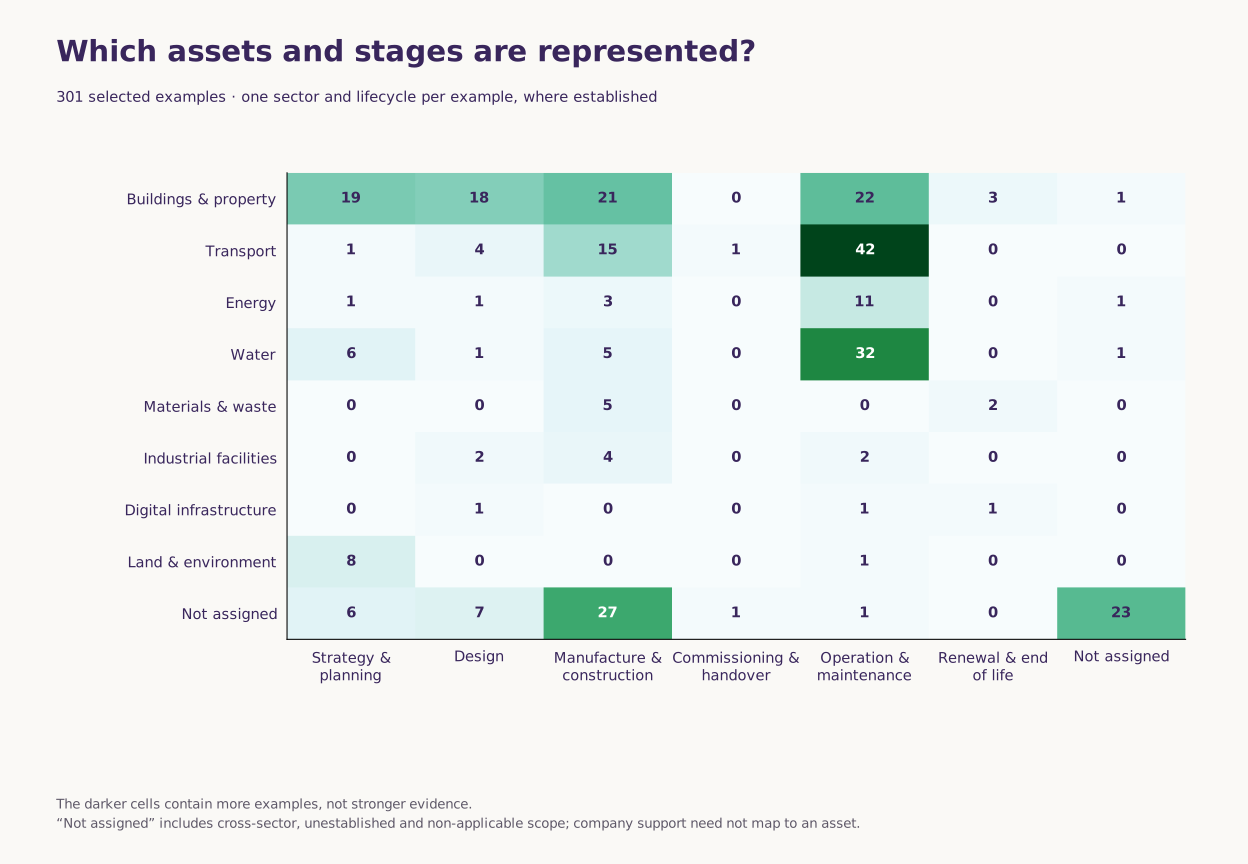
Operation and maintenance is the largest group in this collection.

Grid of the 301 examples by asset type and lifecycle stage

Operation and maintenance accounts for 112 cases, against 34 in design. Buildings and property (84), transport (63) and water (45) are the largest asset groups. Find the cells closest to your own work.

Open the full-size chart →
How to read this chart

Each example is counted once, by its main asset type and lifecycle stage where these are known. “Not assigned” covers company-wide and cross-sector work.

How the collection has grown

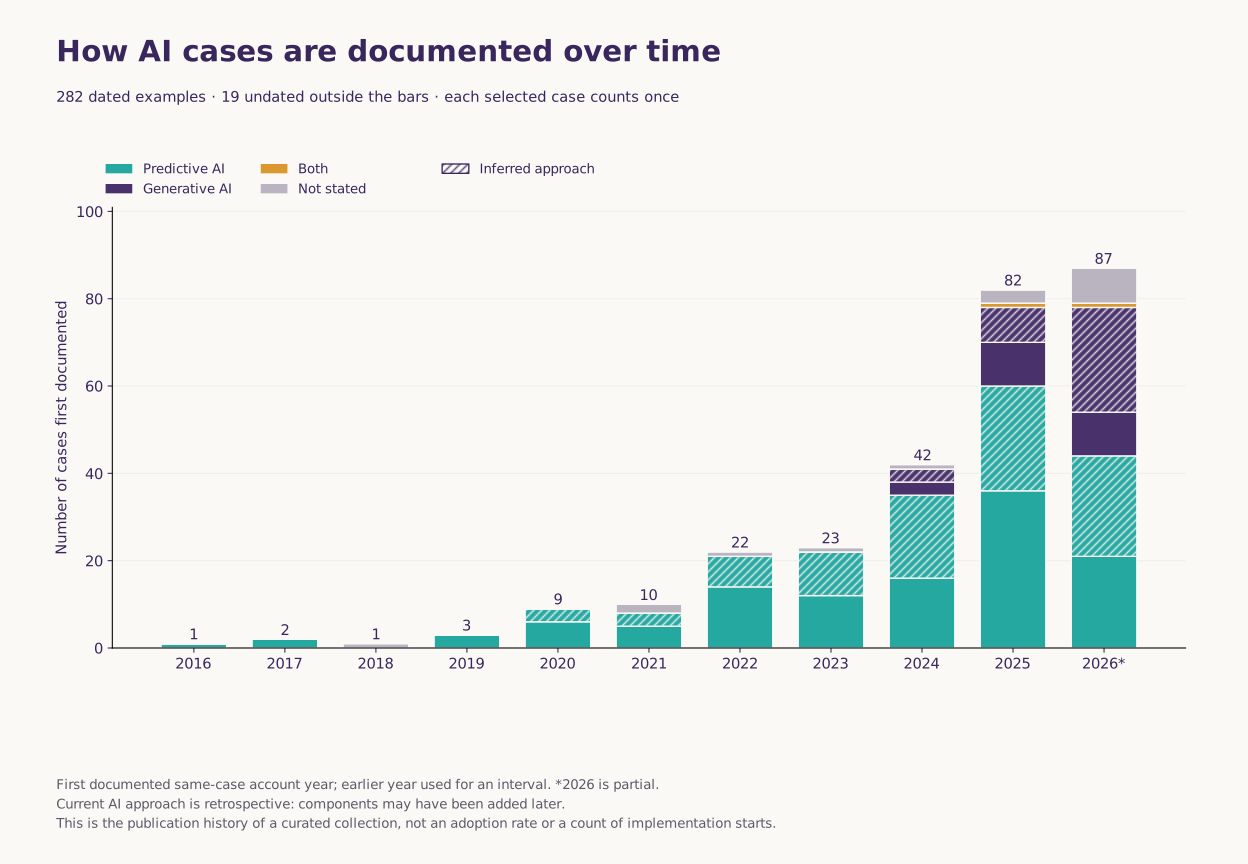
Most examples in this collection were first documented from 2024 onwards.

Stacked bar chart of 282 dated examples by year first documented and type of AI

The collection has 42 examples first documented in 2024, 82 in 2025 and 87 so far in 2026. Generative AI went from a handful of examples in 2024 to over a third of those first documented in 2026.

Open the full-size chart →
How to read this chart

Each case is placed in the year it was first publicly documented; 19 undated examples are left out. This is the publication history of a curated collection, not an adoption rate. The type of AI is today’s description; some components may have been added later. 2026 is a part year.

Claimed time savings

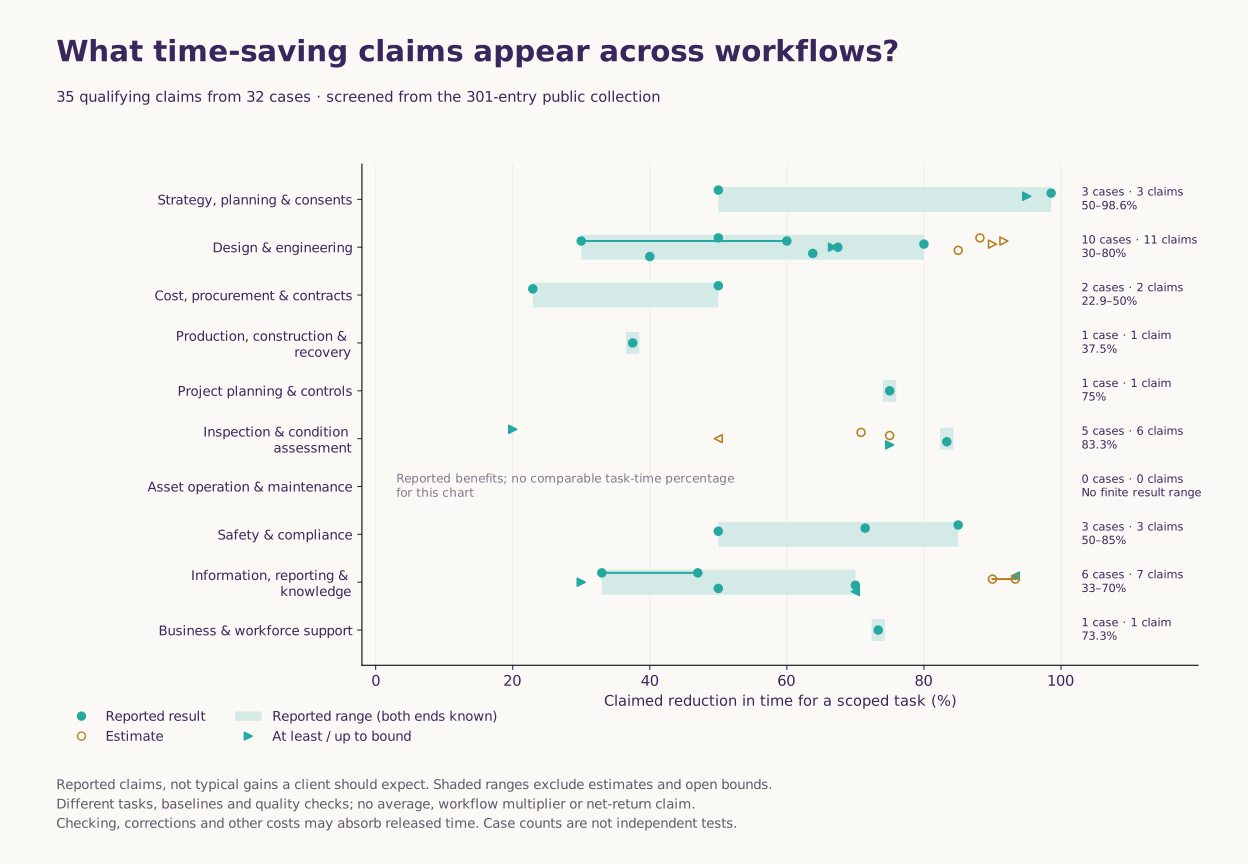
Claimed savings on single tasks are often half the time or more. The sources seldom measure the time spent checking and correcting the output.

Dot chart of 35 task-time saving claims from 32 cases, grouped by workflow

There are 35 time-saving claims in 32 cases. Most claim savings of 50% or more on one task. Asset operations report other benefits, such as energy savings, less leakage and fewer reactive visits, which are not time measures and so are not on this chart.

These are claims, not results you should expect. No average is calculated, because tasks, baselines and checks differ.

Open the full-size chart →
How to read this chart

Each point is one claim about one task. Filled points are reported results, hollow points are estimates and arrows are open-ended claims such as “more than 75%”. Connected points show a range the source gave. Several claims can come from one case.

See all 35 claims, with the limits of each

Workflows follow each case’s maintained primary classification. Claims without a usable task-time denominator, elapsed approval or service time, schedule recovery and algorithm-only runtimes are excluded. A row with no qualifying claim does not establish that the workflow has no benefit.

Strategy, planning & consents

Inspection & condition assessment

Cost, procurement & contracts

Information, reporting & knowledge

  • EC-072 · SchemeFlow / V3 Companies — First-draft environmental assessment: 33–47% (reported result). Supplier-reported first-draft saving, with human checks. No independent replication or complete assessment-workflow saving.
  • EC-084 · SBB / CSEM — Relay identification against maximum legacy time: Up to 93.3% (reported result). 20 seconds per relay versus up to five minutes previously. The calculated upper threshold uses a maximum comparator, not a typical baseline.
  • EC-216 · KD Construction — Daily inspection-log preparation: 90–93.3% (estimate). An executive's estimate of 30–45 minutes versus about three minutes for daily inspection logs. Accuracy, corrections and setup effort were undisclosed.
  • EC-220 · GeoVerra — Large-project feature extraction/classification: At least 30% (reported result). Manager-reported at-least-30% time saving on large feature-extraction/classification projects. Baseline was undisclosed; not established for the separate named corridor examples.
  • EC-246 · Coenradie — Processing survey data: 70% (reported result). Reported 70% reduction in survey-data processing time. Not complete survey effort; scanning and AI contributions were not isolated.
  • EC-318 · Kajima / CONXAI DocNostic — Document-processing proof of concept: 50% (reported result). Reported 50% reduction in the 2023 document-processing proof of concept. Different stage and tasks from the later deployed claim; do not pool them.
  • EC-318 · Kajima / CONXAI DocNostic — Later deployed document-processing tasks: Up to 70% (reported result). Reported up-to-70% reduction for later deployed document-processing tasks. Different stage and tasks from the proof of concept, not an incremental 20-point gain.

Design & engineering

  • EC-075 · VIKTOR / named customer cases — Engineering each horizontal drilling bore: 50% (reported result). Supplier-reported engineering time per bore at Heijmans; no customer-owned confirmation in the retained evidence.
  • EC-077 · Hyundai Engineering / Bentley — Industrial structural design and analysis: 30–60% (reported result). Supplier-reported structural design and analysis range; not a whole-project saving. Design acceptance and review effort were undisclosed.
  • EC-107 · Arup / YJK AI Designer — Structural-design iteration: 80% (reported result). 2.5 days versus 0.5 days in a structural-design comparison. Engineer review remained; full method, sample and accepted-design outcome were undisclosed.
  • EC-124 · Obayashi Corporation / Tektome early-design regulatory research — Early-design regulatory research: 67.4% (reported result). 4.3 versus 1.4 hours of regulatory research per person per week. Sample, period and comparison method were undisclosed.
  • EC-217 · Severino Trucking — Terrain-model preparation: 85% (estimate). Contractor estimate for terrain-model preparation on typical 30–60-acre sites. Sample, model acceptance and checking effort were unknown.
  • EC-277 · Arcadis / Nomic — One engineer's structural reviews: 63.8% (reported result). 185 versus 67 hours for one engineer's structural reviews on one project. Matched scope and accepted-quality comparison were unverified.
  • EC-293 · Miller Electric / Augmenta — Electrical modelling in a retrospective pilot: 40% (reported result). Around 40% less electrical modelling time in a retrospective pilot on two historical projects. Not live-project or whole-design productivity.
  • EC-301 · E-J Electric Installation Co. / Augmenta — Initial electrical model population: 88.2% (estimate). 82 reported hours versus an estimated 693-hour baseline for initial electrical model population. Comparator method, review and revision effort were undisclosed.
  • EC-310 · Cleveland Construction / Trunk Tools — First-pass technical-submittal analysis: Approx. at least 91.7% (estimate). About ten minutes versus an estimated two-or-more manual hours. An approximate threshold for first-pass submittal analysis, not complete architect review or approval.
  • EC-310 · Cleveland Construction / Trunk Tools — Selected field-document lookup: Approx. at least 90% (estimate). A selected two-minute field-document answer versus customary manual lookup of twenty minutes or more. Estimated comparator, without matched timing.
  • EC-323 · Bureau / Motif — Standard office-booth visual preparation: At least 66.7% (reported result). One hour versus twenty minutes or less for standard office-booth visuals. Designers still selected and edited outputs; not a matched-quality test or engineering acceptance.

Project planning & controls

  • EC-082 · Kajima — Site-material inventory cycle: 75% (reported result). About two hours versus 30 minutes for a site-material inventory cycle. Site-specific reported comparison, without an independent timing method.

Production, construction & recovery

Business & workforce support

Safety & compliance

  • EC-281 · Kier Highways / FYLD — Field-worker risk-assessment preparation: 85% (reported result). Reported 17 minutes saved against a 20-minute field-worker assessment average. Total effort after corrections and manager review was unknown.
  • EC-306 · Southern Water / FYLD — Gathering/uploading pollution evidence: 71.4% (reported result). 70 versus 20 minutes for gathering and uploading pollution evidence. Not complete incident response; timing sample and comparison dates were undisclosed.
  • EC-317 · Hilti / CONXAI SiteLens — Entering firestop-selection inputs: 50% (reported result). Reported 50% reduction in entering firestop-selection data. Not complete selection, installation or compliance; checking effort was unmeasured.

Your question

Ask the database your question.

I can analyse the database around whatever would help you decide: the work you want to improve, an asset type, a stage of delivery, a technology, a place, a reported benefit or a practical constraint.

You get the relevant comparisons, the reported benefits and how far to trust them, the gaps, and what your own trial would need to prove. The analysis goes further than this site, with more detail and examples not published here. Where the public evidence cannot answer your question, I will tell you so.

Go deeper

Explore the evidence yourself.

The cases

301 examples

Search by company, place, type of work or technology. Start with a hand-picked set of strong built-environment cases.

Browse the cases →

The map

Where they are

Every example on one map. Filter by type of work, asset, region or type of AI.

Explore the map →
How to read the evidence

Each example records what a source says, who said it, its scope and its limits. Every summary is checked against its source, but the outcome is not audited. Reported results, estimates, targets and research are kept separate. Several cases can share a supplier or source, so they are not independent tests.

The collection reflects what gets published, so it is not a measure of how widely AI is used. Survey results depend on who answered and what was asked, and different surveys are never averaged together.

Cases reviewed 12 October 2026; summary and charts updated 14 October 2026. Survey catalogue covers material published or current from 24 September 2025 to 24 September 2026.